General reading / Note 02 / Spectroscopy
What light leaves behind
A spectrum describes an interaction, one wavelength at a time.
An educational note, separate from company information.
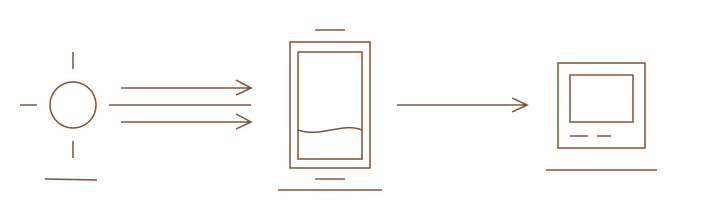
An interaction becomes a reading
Spectroscopy studies interactions between matter and electromagnetic radiation. Different methods examine different parts of the spectrum and different kinds of interaction. Ultraviolet-visible spectroscopy, often shortened to UV-Vis, looks at ultraviolet and visible light.
For an absorption measurement, the central question is how much light a sample absorbs at different wavelengths. The resulting spectrum is usually displayed as a response plotted against wavelength. It is a description of the interaction under measurement conditions, rather than a picture of the sample’s shape or surface.
A comparison makes the signal useful
Transmittance compares light passing through a sample with reference light. Absorbance expresses the reduction on a logarithmic scale. Keeping those labels distinct matters: a high value on one type of plot does not mean the same thing as a high value on the other.
Imagine a hypothetical transparent solution that absorbs some wavelengths more strongly than others. Its spectrum could show a broad absorption band. That illustration gives a way to read the idea of a band; it does not identify a substance, establish its purity or demonstrate a company measurement.
The container, solvent and conditions can affect the reading. A reference helps account for contributions that are not the intended subject of the measurement. Context belongs beside the trace, rather than being left for a reader to guess.
A clue needs an explanation
A spectrum can help investigate a material, but a single feature is not automatically a unique identity. Similar-looking responses may require additional evidence, and a change in measurement conditions can change the view. Interpretation depends on the method and the question being asked.
Start by reading the axes and units. Look for a description of the sample and reference, then ask which claim the spectrum is being used to support. Is the author comparing patterns, following a change, or estimating an amount? Naming the question makes the explanation much more useful than treating every peak as a complete answer.
Further reading: Agilent’s UV-Vis primer (PDF).